Debugger Overview
The FactsDB Debugger is an essential companion tool for development. It provides an unparalleled, real-time view into the entire state of the FactsDB system while your game is running. Using it effectively can drastically reduce the time it takes to diagnose bugs, verify logic, and balance gameplay without relying on scattered Print String nodes or breakpoints.
Key Concepts
Before diving in, it's helpful to understand a few core terms:
- Schema: The static "blueprint" for a set of facts. It defines which facts exist, their data types, and their default values. You typically work with schemas when the editor is not in a PIE session.
- Context: A live, runtime instance of a schema. If a schema is the template for an "Enemy", a context is a specific "Goblin" instance in the world with its current health and status. You work with contexts during a PIE session.
- Fact: An individual piece of data within a context, like
Health,AmmoCount, orbIsStunned.
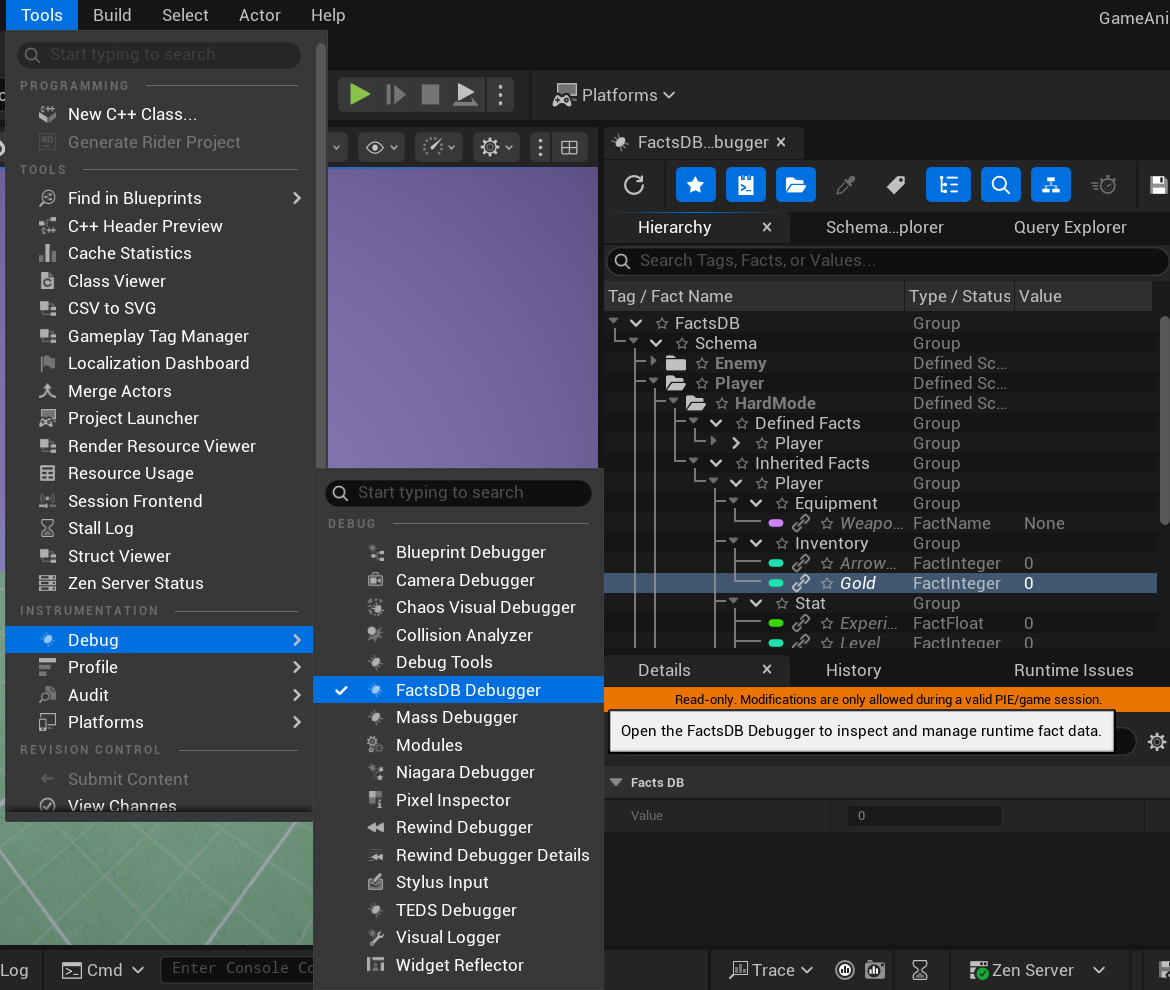
Opening the Debugger
To open the debugger, go to the main editor menu and select Window > FactsDB Debugger.
Editor Mode vs. PIE Mode
The debugger's display changes fundamentally depending on whether a Play-In-Editor (PIE) session is active.
- Editor Mode (Not Playing): The debugger displays all the defined Schemas and their default values as configured in your project's DataTables. This mode is perfect for verifying your static data setup and understanding inheritance.
- PIE Mode (Playing): The debugger switches to a live view, showing all the active runtime Contexts and their current, real-time fact values. This is the primary mode for debugging gameplay logic.
The Main Interface
The debugger is composed of several dockable panels, organized into a flexible layout.
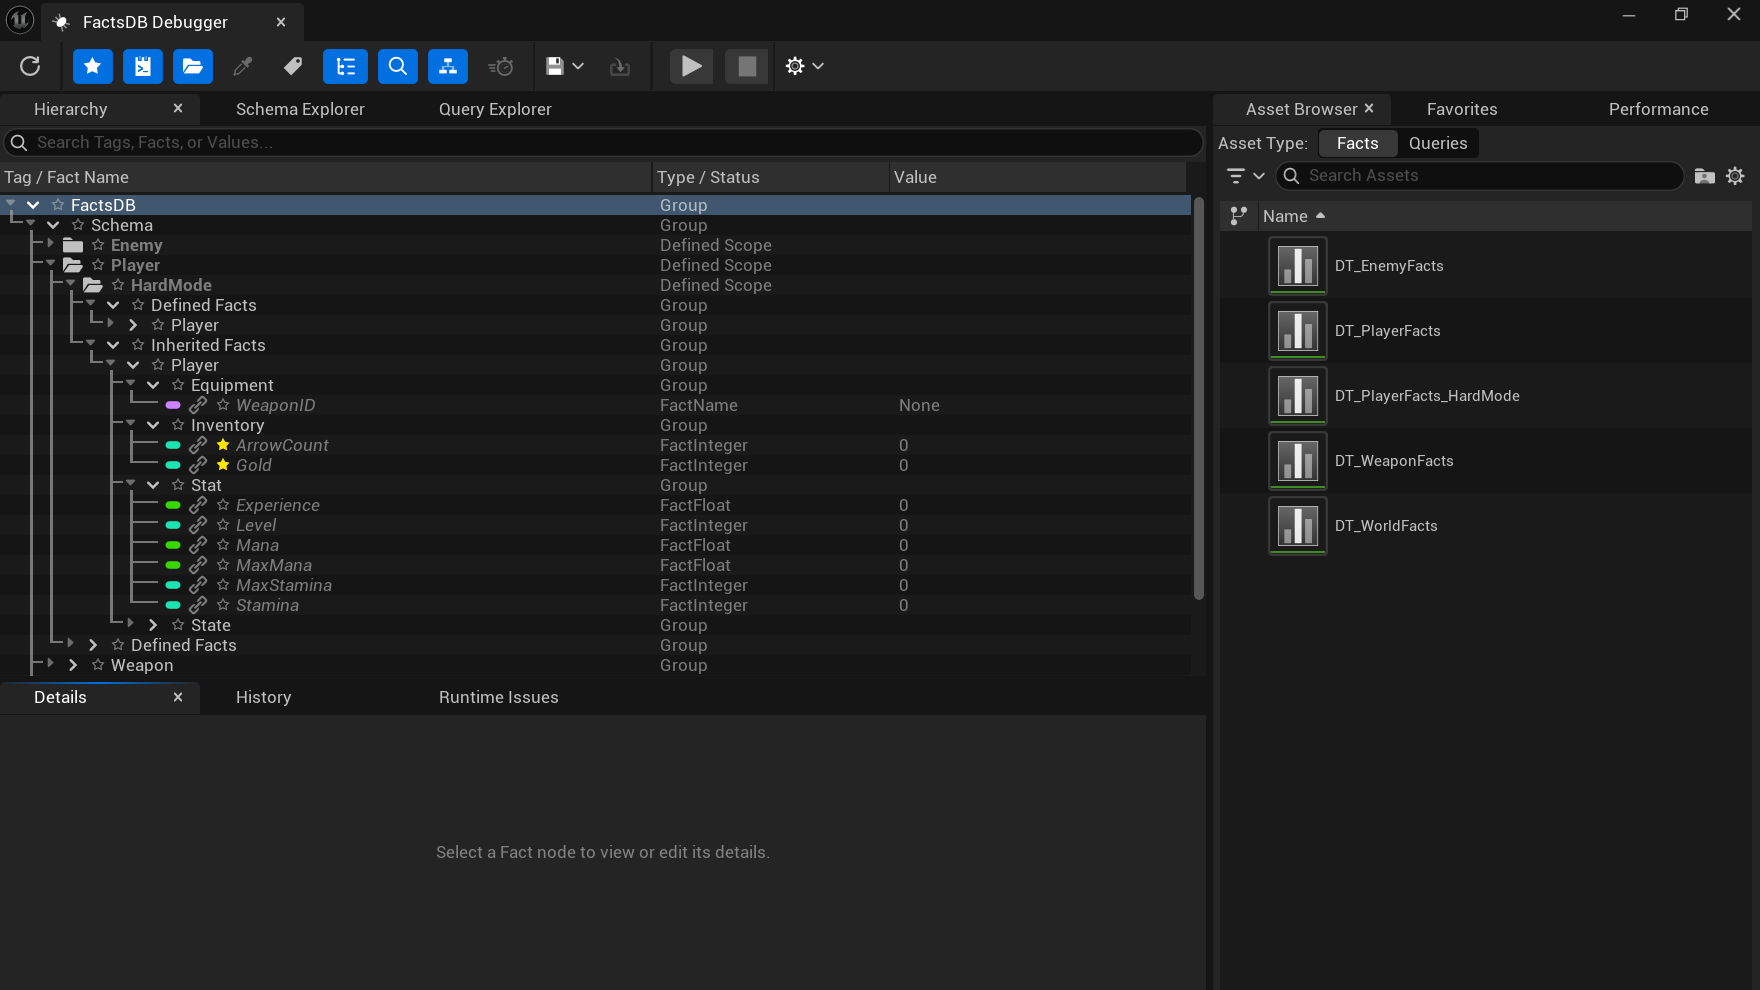
1. Toolbar
The toolbar at the top provides quick access to the most common actions:
- Refresh: Manually refreshes all data from the live game session.
- Toggle Panels: Buttons to show or hide the various panels like Favorites, History, Performance, etc.
- Filter by Selected Actor: When active, the Hierarchy view will only show the Context associated with the Actor currently selected in the main level viewport. This is extremely useful for focusing on a specific character or object.
- Toggle Hierarchical Display: Switches the main Hierarchy view between a flat list of facts and a nested view based on their Gameplay Tag structure.
- Toggle Real-time Updates: When enabled, the debugger automatically updates as facts change in the game. You can disable this to "freeze" the state for careful inspection.
2. Hierarchy View (Main Panel)
This is the central panel where you can browse all defined Schemas (in Editor Mode) or active Contexts (in PIE Mode).
- Scope Nodes (Folders): Represent a Schema or a live runtime Context. Runtime Contexts are labeled with their owning Actor's name for easy identification.
- FactTagGroup Nodes (Chevrons): These are intermediate "folders" created from the segments of a Gameplay Tag when in hierarchical view.
- Fact Nodes (Pills): Represent an individual Fact with its data. The color of the "pill" icon corresponds to its data type, matching the colors of Blueprint pins.
3. Details Panel
When you select a Fact node in the Hierarchy view, the Details panel will show its value in a property editor.
- Live Editing: This is one of the debugger's most powerful features. During a PIE session, if you have network authority, you can modify the value directly in the Details panel. The change is sent to the game immediately, allowing for real-time tweaking, cheating for test purposes, or forcing specific states to debug logic.
- Metadata: It also displays useful metadata like the fact's
TypeName, its read-only status, and whether the current value is a schema default or has been modified.
4. Auxiliary Panels
The debugger includes several other powerful panels that can be opened from the toolbar or the "Window" menu button within the debugger:
- Schema Explorer: A dedicated tool for visualizing schema inheritance and finding where any fact is defined.
- Query Explorer: A dedicated environment for analyzing and live-testing your
FFactQueryTagdefinitions. - Favorites Panel: A dockable list of facts or contexts you have "starred" for quick access.
- History Panel: A chronological log of every single fact change that has occurred, showing old and new values.
- Runtime Issues Panel: A log that captures logical errors from the FactsDB system (e.g., a
Get Factcall that failed) and provides a link to jump directly to the Blueprint node that caused the issue. - Performance Panel: Displays real-time metrics about the system's performance, such as memory usage, cache hit rate, and event throughput.
- Asset Browser: Helps you find the source
UDataTableorUDataAssetfor your fact and query definitions.
The following pages will explore the usage of these panels in greater detail.
Next Up: Hierarchy and Details Panels