The Query Explorer
The Query Explorer is a dedicated environment within the FactsDB Debugger for analyzing, debugging, and live-testing your data-driven queries. It helps you understand exactly why a query returns true or false in any given situation.
To access it, open the Query Explorer tab from the debugger's panel layout.
Interface Overview
The Query Explorer is split into two main sections: the Query Hierarchy on the left, and a Workspace with several tabs on the right.
Query Hierarchy
This tree view lists all FFactQueryTag definitions that have been loaded from your project's UFactsDBQueryDefinition assets.
- You can use the search bar to filter the list by tag name.
- Selecting a query in this tree will populate the workspace panels on the right with its information.
Workspace Panels
Once a query is selected, you can use the workspace tabs to analyze it from different angles.
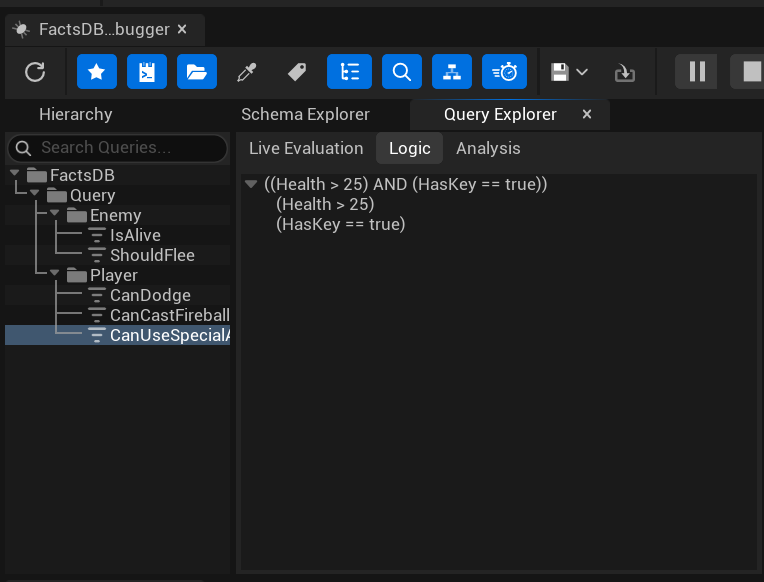
1. Logic Tab
This tab provides a simple, read-only tree view that visualizes the logical structure of the selected query. It expands nested queries and Query by Reference nodes, giving you a clear picture of all the conditions that make up the final query.
This is useful for quickly understanding the composition of a complex query without having to open the data asset itself.
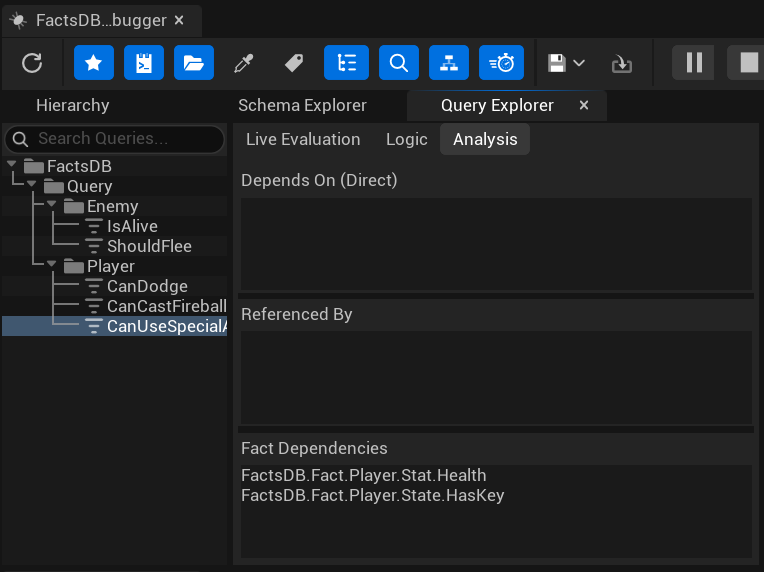
2. Analysis Tab
This tab performs a static analysis of the selected query and shows its relationships to other parts of the system. It's divided into three lists:
- Depends On (Direct): Lists all other
FFactQueryTagsthat are directly referenced by the selected query via aQuery by Referencenode. - Referenced By: Lists all other queries in the entire system that reference the currently selected query. This is incredibly useful for assessing the impact of changing a query's logic.
- Fact Dependencies: Lists all the unique
FFactTagsthat are read by the query's conditions. This tells you exactly which pieces of data influence the query's outcome.
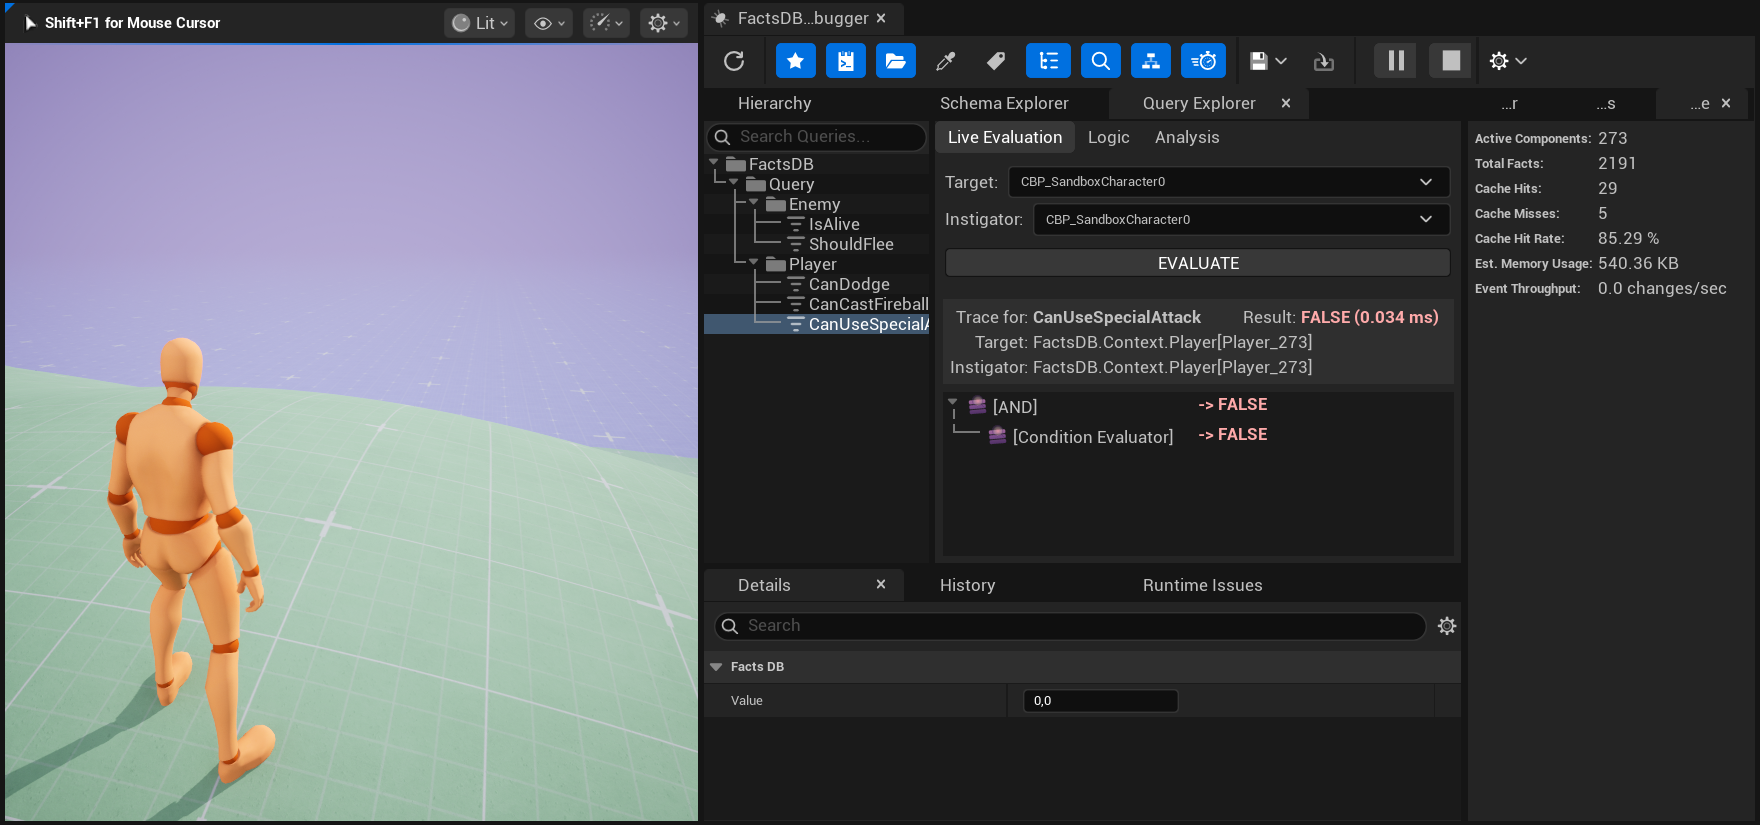
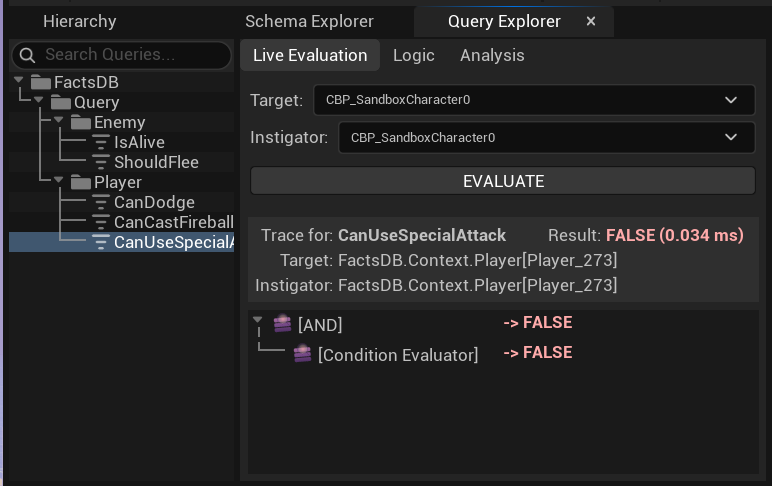
3. Live Evaluation Tab
This is the most powerful tab. It allows you to execute the selected query in real-time against any live context from your PIE session and see a detailed, step-by-step trace of its execution.
How to Use:
- Make sure you have a PIE session running.
- Select a query to test from the Query Hierarchy list on the left.
- Select a Target: Use the "Target" combo box to choose the
FFactContextIDyou want to run the query against. This dropdown is populated with all currently activeUFactsComponentinstances. - (Optional) Select an Instigator: Some queries might use the "Instigator" context (e.g., to check a fact on the player who initiated an action). You can select that here.
- Click the EVALUATE button.
The Trace View:
After you click evaluate, the trace view below will populate with the results.
- Header: Shows the final
TRUEorFALSEresult of the query, the total evaluation time in milliseconds, and the contexts used. - Execution Tree: The tree shows every step of the evaluation.
- Each row represents a single logical block (an
AND,OR,NOT, orCondition). - It shows the description of the step (e.g.,
(Health > 50)). - It shows the intermediate
TRUEorFALSEresult of that specific step.
- Each row represents a single logical block (an
- Color-Coding: Results are color-coded green for
TRUEand red forFALSE, allowing you to see at a glance where in a complexANDorORchain the logic succeeded or failed.
By expanding the nodes in the trace view, you can follow the exact path the evaluation took and pinpoint precisely why a query is returning an unexpected result.
Next Up: Diagnostic Panels