Diagnostic Panels: History, Issues & Performance
Beyond inspecting the current state, the FactsDB Debugger provides several powerful diagnostic panels to help you understand how your data changes over time, catch logical errors, and monitor performance.
History Panel
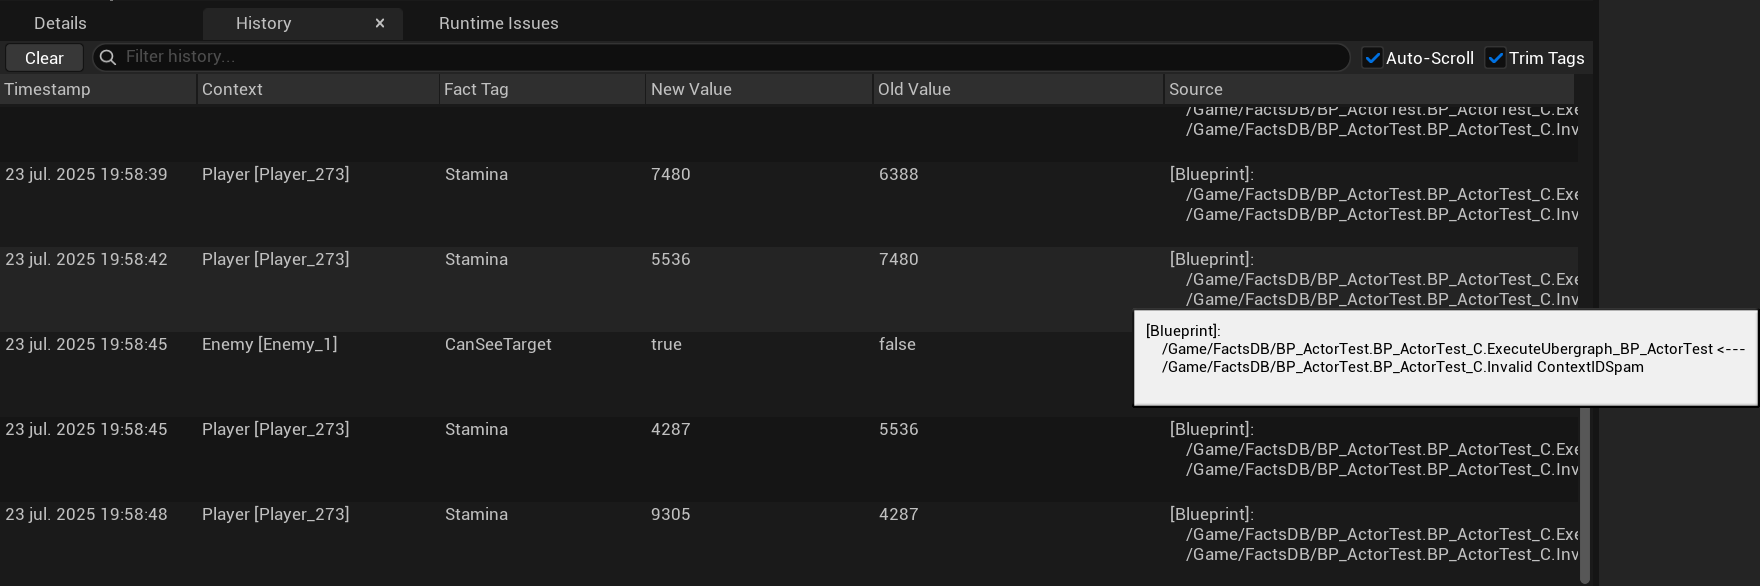
The History Panel is a chronological log that records every single fact change that occurs during a PIE session. It is an invaluable tool for debugging issues that happen over time or for understanding why a fact has an unexpected value.
Features
- Toolbar:
- Clear: Wipes all current entries from the log.
- Filter: A search box to filter the log by any column's content (e.g., a specific Fact Tag or Context ID).
- Auto-Scroll: If checked, the list will automatically scroll to the bottom as new changes come in.
- Trim Tags: If checked, long
GameplayTagnames will be shortened for better readability in the list. Hover over any trimmed tag to see its full name in a tooltip.
- Columns:
- Timestamp: The precise time the change occurred.
- Context: The
FFactContextIDwhere the change happened. - Fact Tag: The tag of the fact that was modified.
- New Value / Old Value: The value of the fact after and before the change.
- Source: If enabled, shows the Blueprint or C++ callstack that triggered the update. This is extremely powerful for tracking down the origin of a change.
For performance reasons, history logging is disabled by default. To enable it, you must use a console command during your PIE session:
facts.EnableChangeHistory 1- Enables basic logging (Timestamp, Context, Fact, Values). Low performance impact.
facts.EnableChangeHistory 2- Enables logging with stack tracing for the "Source" column. This has a significant performance cost and should only be used when actively debugging a specific issue.
Runtime Issues Panel
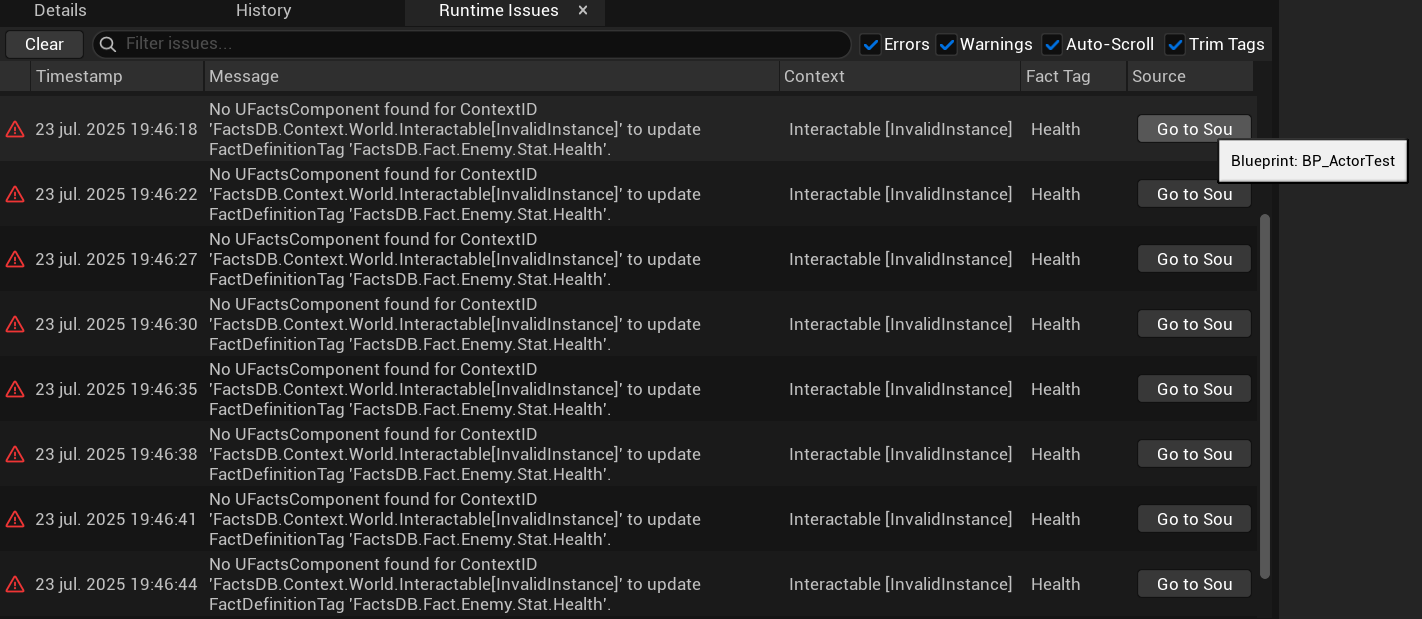
This panel is your safety net. It automatically captures and logs logical errors and warnings generated by the FactsDB system at runtime. Unlike compile errors, these are issues that only become apparent during gameplay.
Examples of captured issues:
- A
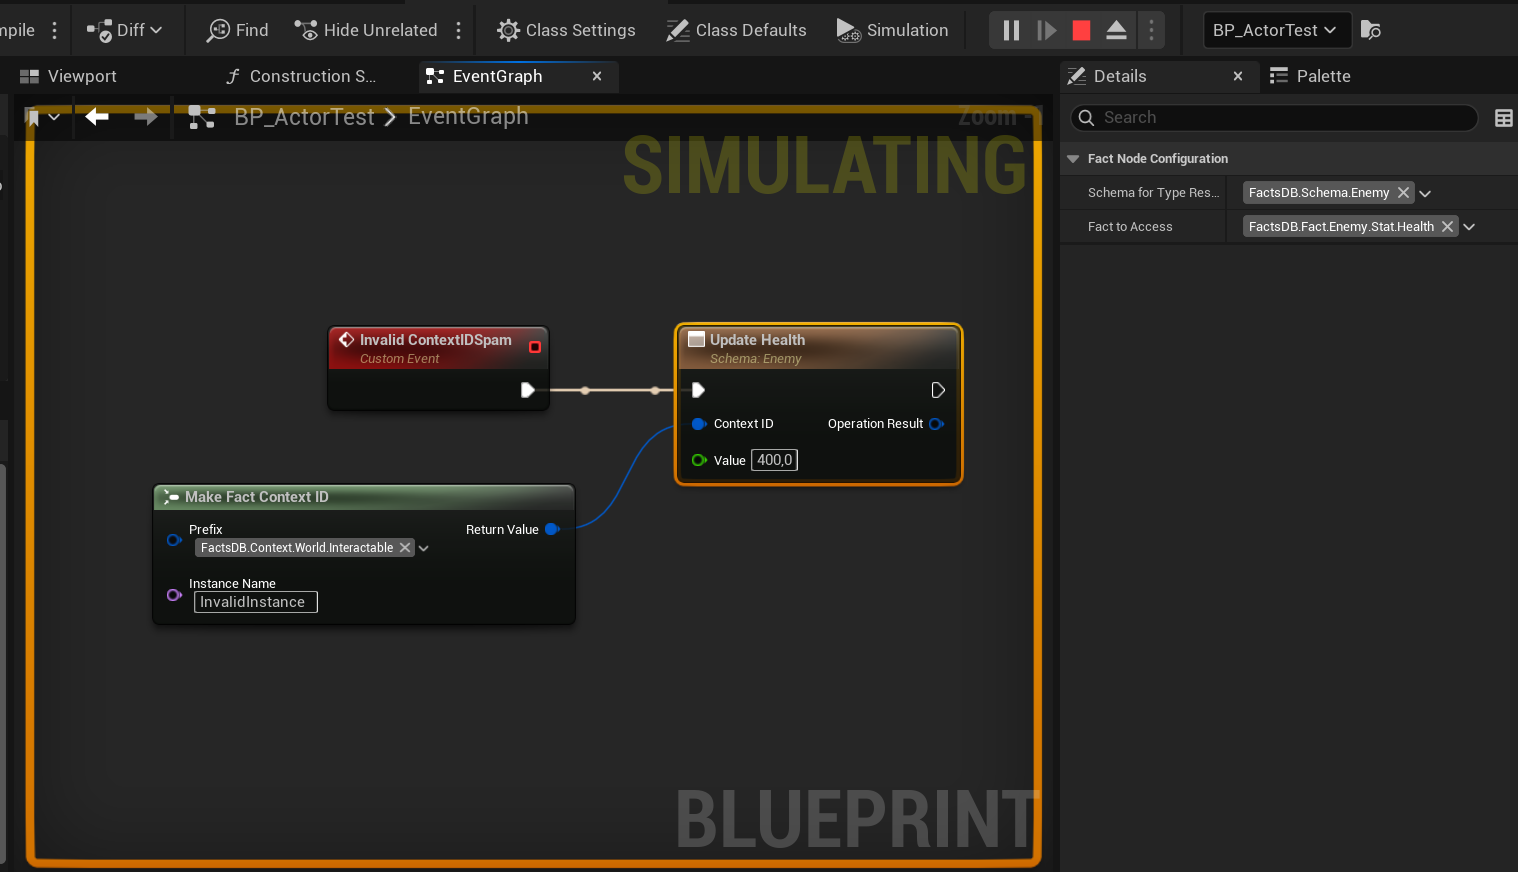
Get Factnode fails because the specified Fact Tag doesn't exist in the target Context. - An
Update Factnode is called on a read-only Fact. - An async listener node is created with an invalid Context ID.
- A query fails to evaluate because it references a non-existent query tag.
Features
- Severity Icon: Shows whether the issue is a critical
Erroror a non-blockingWarning. - Message: A human-readable description of what went wrong.
- Context / Fact Tag: The specific context and fact involved in the issue, if applicable.
- Go to Source Button: For issues originating from a Blueprint, this button is a powerful shortcut. Clicking it will open the corresponding Blueprint and focus directly on the specific node that caused the error, allowing for immediate correction.
Performance Panel
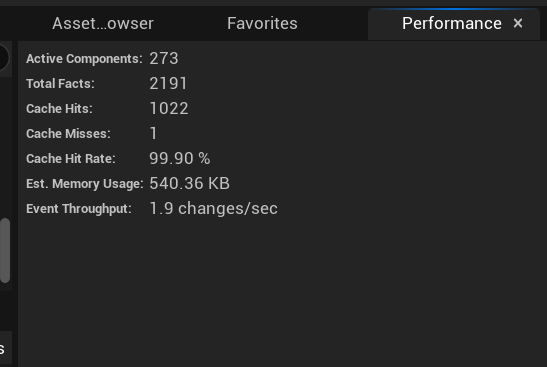
This panel provides a live, at-a-glance view of the system's performance metrics. It's useful for ensuring that FactsDB is not becoming a performance bottleneck in your project, especially in scenarios with many active components.
Metrics Tracked
- Active Components: The total number of
UFactsComponentinstances currently registered with the subsystem. - Total Facts: The total count of all
FFactInstances across all active components. - Cache Hits / Misses / Hit Rate: Statistics for the optional LRU cache on
UFactsComponent. A high hit rate (e.g., >90%) indicates the cache is effectively speeding up repeatedGetFactcalls. - Est. Memory Usage: An approximation of the total memory consumed by all fact data, useful for memory profiling.
- Event Throughput: The number of fact changes being processed per second. This is a key indicator of how "busy" the system is. A very high or spiky number might suggest an opportunity to use Batch Updates.
Next Up: The Asset Browser